The Dependents Report provides administrators with a comprehensive view of dependent enrollment, registration trends, and activity status. This report is essential for tracking the adoption of the platform among family members and identifying where follow-up communication may be needed.
*If your company does not has "Dependents" feature you wont see this in your
1. Navigating to the Report
To access this data, log in to your Admin Dashboard and use the sidebar menu:
-
Click on Reports.
-
Select Dependents.

2. Understanding the Key Metrics
At the top of the report, you will see three primary KPIs that summarize your dependent population:
-
Total Dependents: The total number of dependents invited to the system within your selected date range.
-
Pending: Dependents who have been invited but have not yet completed their registration.
-
Active: Dependents who have successfully completed registration and are currently active users.
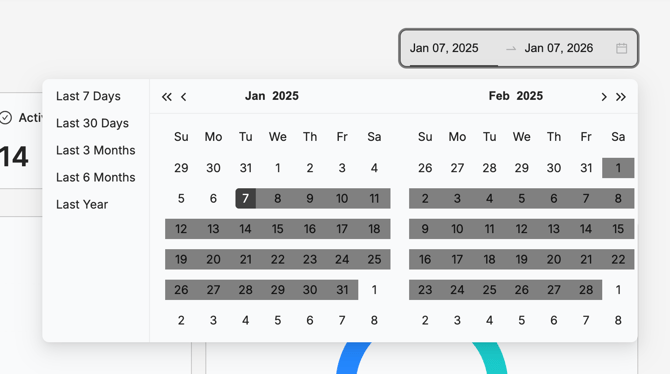
3. Date Range Filtering
By default, the report may show a specific window. You can customize this by clicking the Date Picker in the top right corner. You can select from presets like Last 30 Days or Last Year, or click specific dates on the calendar to set a custom range.
4. Visualizing Trends and Distribution
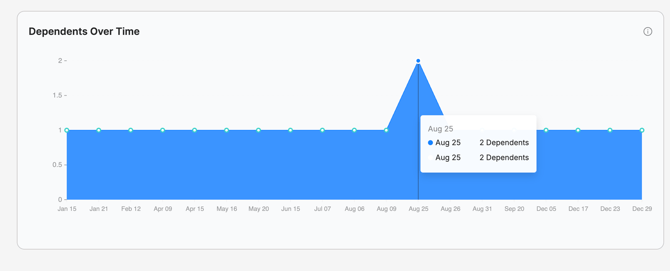
Dependents Over Time
This area chart tracks the volume of dependent registrations over your selected timeframe. This helps you identify spikes in enrollment (e.g., following a company-wide announcement or open enrollment period).
-
Pro Tip: Hover your mouse over any data point on the graph to see the exact number of dependents registered on that specific day.
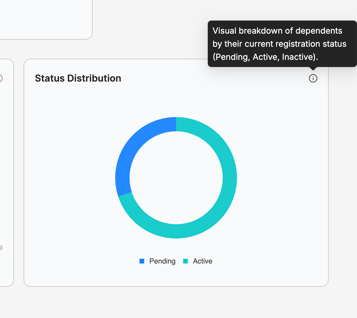
Status Distribution
The donut chart provides a visual breakdown of your dependents' registration health. This is a quick way to see the ratio of Active versus Pending users at a glance.
5. Summary of Tooltips
If you are ever unsure of a definition while using the portal, hover over the information (i) icon next to any header to see a quick definition.