The HR Admin Dashboard is your source of thruth for monitoring team wellbeing. This feature inside your Admin Portal provides a real-time, "at-a-glance" view of how your employees are engaging with the Wellness Coach platform.
How to Access Your Dashboard
Accessing your reports is simple. Follow these steps to navigate to your data:
1. Log in to your Admin Portal:
-
Log in at https://portal.wellnesscoach.live.
-
Enter your login credentials
-
Type in your work email address.
- Click Continue
- Follow your company's progress according to your company's set-up.
-
You will now be redirected to your Admin Portal landing page (Learn more here)
-
2. In the left-hand navigation menu, click on Reports.
3. Select Dashboard from the dropdown menu.
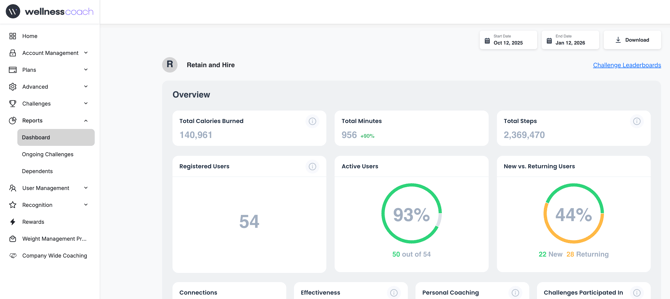
On the top right side, you can: Filter reports by "Start to End Date" and also the capability to download reports in PDF.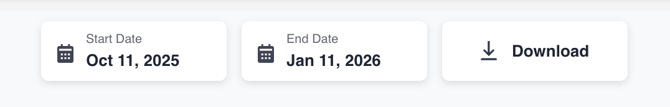
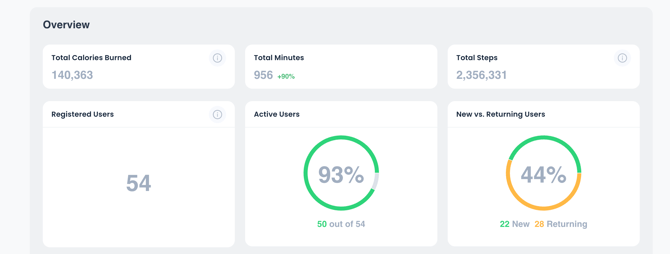
Overview Metrics:
Your dashboard is designed to be intuitive, using visual data to help you track four primary pillars of engagement:
-
Total Calories Burned: Displays the cumulative number of calories burned by all participating team members.
-
Total Minutes: Shows the total time spent in wellness activities, including a percentage indicator (e.g., +90%) to show growth compared to previous periods.
-
Total Steps: Tracks the collective step count across your entire organization.
-
Registered Users: The total number of employees who have signed up for the platform.
-
Active Users: Highlights the percentage of registered users who are currently engaging with the tool (e.g., "50 out of 54" or 93%).
-
New vs. Returning Users: A donut chart that distinguishes between employees using the platform for the first time and those who are returning, helping you measure long-term retention.
-
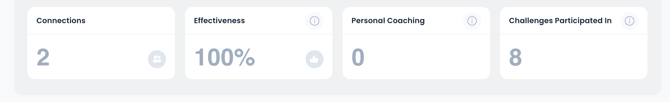
Connections: This metric tracks the total number of connections team members have shared with their friends and family. Each member can share a Starter+ license with up to 5 people.
-
Effectiveness: Represented as a percentage, this shows the overall satisfaction or positive impact rating reported by your team members. A "100%" rating indicates highly positive feedback from the users.
-
Personal Coaching: This displays the number of one-on-one personal coaching sessions your team has engaged in during the selected period.
-
Challenges Participated In: This counts the total number of wellness challenges your team members have joined.
Engagement:
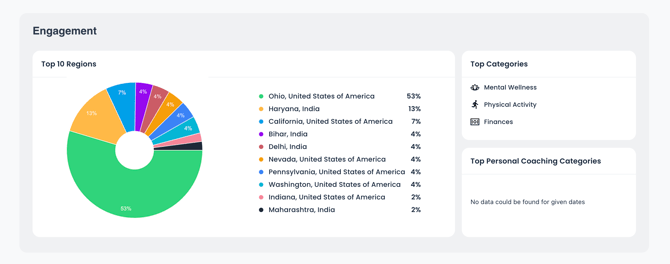
Top 10 Regions: This ranks the number of employees using Wellness Coach by state or region
Top Categories: These are the top 3 most popular types of wellness sessions completed by your team.
Top Personal Coaching Categories: These are the top 3 most booked focuses for Personal Coaching sessions.
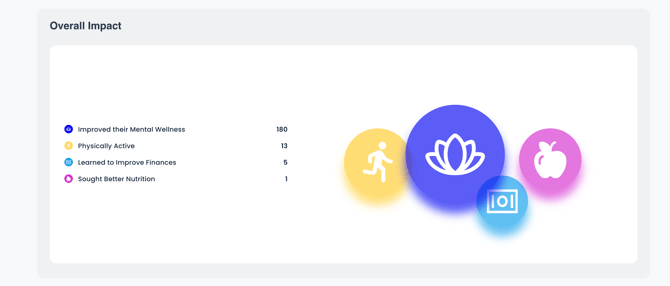
Overall Impact:
The Overall Impact section ranks the number of sessions your team completes by wellness category. The number on the right column is how many sessions completed that helps achieve the goal on the left column.